Database Performance Tuning | A Practical Guide for DBAs
Database Performance Tuning: A Systematic Approach for SQL Server DBAs Key takeaways: Wait statistics reveal the true bottlenecks in your SQL Server environment, not guesswork...
Database Performance Tuning: A Systematic Approach for SQL Server DBAs
Key takeaways:
Wait statistics reveal the true bottlenecks in your SQL Server environment, not guesswork or assumptions
Query optimization starts with execution plans: understanding seeks vs. scans, implicit conversions, and parameter sniffing
Index strategy requires balancing read performance against write overhead; more isn’t always better
SQL Server’s default configuration prioritizes stability over performance; memory, TempDB, and parallelism settings need tuning
Proactive monitoring catches performance degradation before users complain
Most DBAs spend their days chasing symptoms without identifying the root cause. Database performance tuning breaks that cycle, but only when you stop guessing and start measuring.
The culprit usually isn’t hardware. It’s inefficient queries, missing indexes, and misconfigured settings that create artificial bottlenecks. The difference between reactive troubleshooting and proactive optimization is methodology: knowing where to look, what to measure, and how to interpret the data SQL Server is already tracking.
SQL Server Wait Statistics: Where to Start Performance Tuning
When a query runs slowly, SQL Server records exactly where time is spent. SQL Server tracks time spent waiting on disk I/O, locks, CPU scheduling, and memory-related resources. These wait statistics are the most direct path to identifying bottlenecks, yet many DBAs still tune by intuition rather than data.
How to read sys.dm_os_wait_stats
The sys.dm_os_wait_stats DMV aggregates waits at the instance level. It shows you where SQL Server spends the most time waiting. But the raw data includes benign waits like BROKER_TASK_STOP and SQLTRACE_INCREMENTAL_FLUSH_SLEEP that inflate the totals without indicating actual problems. These represent background or idle activity, not resource contention. Filtering them out is step one, though which waits you exclude depends on your environment.
Once you’ve isolated the meaningful waits, patterns emerge. PAGEIOLATCH_SH dominating usually indicates a physical I/O problem, either slow storage or queries that read more data than necessary. CXPACKET waits appearing alongside high PAGEIOLATCH waits means parallelism is spreading I/O pressure across multiple threads, which can amplify the problem rather than solve it. Significant WRITELOG waits point to transaction log bottlenecks, often from undersized log disks or applications that commit too frequently instead of batching writes.
PAGEIOLATCH, LCK_M, SOS_SCHEDULER_YIELD, and ASYNC_NETWORK_IO explained
PAGEIOLATCH waits often signal queries waiting for data pages to be read from disk into the buffer pool. When your working set exceeds available memory, you’ll see these waits. Same goes for queries performing large scans that can’t benefit from caching. The fix isn’t always more RAM. Rewriting queries to read less data or adding indexes to avoid scans often matters more. A query scanning 10 million rows to return 100 will generate PAGEIOLATCH waits even on a server with plenty of memory, because scans that touch more pages than can stay resident in cache keep evicting pages to make room for new data.
LCK_M waits mean queries are blocked waiting for locks held by other transactions. The blocking chain in sys.dm_exec_requests and sys.dm_tran_locks will show you which SPID is holding the lock and what object is contended. Here’s what catches people off guard: sometimes the blocking query isn’t the problem. The victim query might be the one scanning a million rows unnecessarily, forcing SQL Server to hold locks longer than it should. Fix the victim’s inefficient query plan and the blocking often disappears.
SOS_SCHEDULER_YIELD shows up when SQL Server has more active threads than CPU cores, forcing threads to yield their time slice. This is CPU pressure. Throwing hardware at it alone rarely helps unless CPU saturation is purely a capacity issue. The better path is reducing CPU consumption per query through better indexing, more efficient T-SQL, or redistributing the workload.
ASYNC_NETWORK_IO waits occur when SQL Server has sent results to the client application but the client hasn’t acknowledged receipt. This is rarely a SQL Server engine problem. Look at network latency or an application processing results too slowly. Check whether the application is doing row-by-row processing instead of batch operations, or running expensive calculations on each row as it arrives.
Wait Type
Root Cause
First Steps
PAGEIOLATCH
Working set exceeds memory; queries scanning too much data
Add indexes to reduce scans; rewrite queries to read fewer rows; check buffer pool memory
LCK_M
Lock contention from blocking chains; long-running transactions
Check sys.dm_tran_locks for blockers; optimize the victim query plan
SOS_SCHEDULER_YIELD
CPU pressure; more active threads than cores
Reduce per-query CPU cost through indexing and T-SQL rewrites
ASYNC_NETWORK_IO
Client app slow to consume results; network latency
Switch client from row-by-row to batch processing; check network
CXPACKET
Parallelism thread synchronization; often accompanies other waits
Adjust MAXDOP and cost threshold for parallelism; fix underlying I/O or CPU issues
WRITELOG
Transaction log bottleneck; slow log disk or excessive commits
Move log to faster storage; batch transactions to reduce commit frequency
How to Read SQL Server Execution Plans and Fix Slow Queries
Execution plans show exactly how SQL Server executes a query: which indexes it uses, how it joins tables, where it sorts or aggregates data. Most performance issues become obvious once you know how to read plans.
Index seeks jump directly to specific rows via the B-tree structure. Scans read through the entire table or index. Scans aren’t automatically bad. Scanning a 50-row lookup table is faster than seeking. But scanning a multi-million-row table to find 10 records signals a missing index. The optimizer chose the scan because it didn’t have a better option.
Implicit conversions and parameter sniffing
Implicit conversions kill performance without warning. Join a VARCHAR column to an NVARCHAR column and SQL Server converts every value at runtime, making indexes unusable. A single implicit conversion can turn a sub-second query into a multi-minute table scan. Advanced query tuning techniques can help you spot these problems before they tank production queries.
Parameter sniffing is a feature that becomes a problem under specific conditions. SQL Server compiles a query plan based on the first parameter values it sees, then reuses that plan for all subsequent executions. Works well when data distribution is relatively uniform. It falls apart when data is highly skewed.
If your first execution has parameter values representing 10 rows, SQL Server creates a plan optimized for 10 rows with nested loops, index seeks, and minimal memory grants. When subsequent executions pass parameter values representing 100,000 rows, they’re stuck with a plan designed for completely different cardinality. The nested loops become a performance disaster. You’ve seen the symptom: a stored procedure that runs fast sometimes and times out other times with identical code.
Tracking query plan regressions with Query Store
Query Store captures execution history and runtime stats for queries over time. When users report that a query “used to be fast,” Query Store shows you exactly when performance degraded and which plan change caused it. Query Store lets you force the old plan back while you investigate the root cause, whether it’s outdated statistics, a change in data distribution, or a SQL Server version upgrade that altered the optimizer’s behavior.
If you haven’t enabled Query Store yet (and you should), sys.dm_exec_query_stats provides similar insights for currently cached plans. Monitoring and analyzing query performance using these DMVs requires scripting and manual aggregation, but scripts modeled after sp_BlitzCache can help surface the most expensive queries by various metrics.
SQL Server Indexing: Balancing Read Performance Against Write Overhead
A well-placed index can transform a 30-second query into a sub-second response. But every INSERT, UPDATE, and DELETE must maintain every index on that table. Over-indexing an OLTP system can cripple write performance.
How to evaluate missing index DMV recommendations
The Missing Index DMVs look like a gift, with SQL Server telling you exactly which indexes to create. In practice, they’re more of a starting point than a prescription. These recommendations are query-specific and don’t consider the broader workload. Creating every missing index suggestion often results in redundant or overlapping indexes.
Evaluate missing index suggestions against existing indexes. If you already have an index on (CustomerID, OrderDate), creating another index on (CustomerID, OrderDate, ProductID) might be warranted, or you might just modify the existing index to include ProductID.
The decision depends on how often queries use the existing two-column index versus how often they need all three columns. If 90% of queries need ProductID, modify the existing index. If only 10% do, the separate index might make more sense to avoid bloating the more frequently used index.
When to use covering indexes in SQL Server
A covering index contains all columns a query needs, eliminating lookups to the clustered index. For queries filtering on CustomerID and returning OrderDate and TotalAmount, an index on (CustomerID) with INCLUDE (OrderDate, TotalAmount) lets SQL Server satisfy the entire query from the index alone. No bookmark lookups. No additional I/O.
Include columns in the index rather than adding them as key columns when they’re not part of the filter or join criteria. Key columns establish the index sort order and support range scans. Included columns are just payload data stored at the leaf level. Adding non-selective columns like descriptions or comments as key columns creates massive indexes without improving seek efficiency. You’re just making every page wider and forcing SQL Server to read more data.
Index fragmentation and statistics maintenance
Fragmentation below 30% rarely impacts performance for singleton lookups. The seek goes directly to the page it needs, regardless of physical order. For reporting workloads with large range scans, fragmentation above 10% can degrade performance noticeably.
A 100-million-row table needs 20 million rows to change before auto-update statistics fire. That’s the scaling problem with SQL Server’s default thresholds. A 20% change threshold works fine for small tables but breaks down at scale.
Outdated statistics produce bad cardinality estimates. Bad cardinality estimates produce inefficient execution plans with table scans where seeks would work, nested loops where hash joins are needed, and inadequate memory grants that spill to tempdb. This is why scheduled FULLSCAN updates matter, especially after large data loads.
SQL Server Configuration Settings That Hurt Performance
SQL Server ships with conservative defaults that prioritize stability over performance. Several of these out-of-the-box settings throttle throughput in ways that have nothing to do with query efficiency or hardware capacity.
Setting
Default
Recommended
Why It Matters
Max server memory
2,147,483,647 MB (all RAM)
Total RAM minus 4GB+ for OS
Prevents OS memory starvation
MAXDOP
0 (unlimited)
4–8 for OLTP
Stops single queries from monopolizing all CPU cores
Cost threshold for parallelism
5
50+
Prevents trivial queries from spawning parallel plans
Max server memory defaults to consuming all available RAM, which starves the operating system and other processes.
The typical approach reserves 4GB for the OS plus 1GB per 8GB of total RAM, but this varies based on your specific environment.
A server running only SQL Server can be more aggressive. A server hosting multiple applications needs to be more reserved.
Buffer pool hit ratio is a frequently misunderstood metric.
A high hit ratio doesn’t mean you have enough memory. It just means the queries you’re running find their data in cache most of the time. If you’re only querying 50GB of a 500GB database, you might have a 99% hit ratio with only 64GB of RAM allocated. The real question is whether your working set fits in the buffer pool or if you’re seeing memory pressure through PAGEIOLATCH waits.
TempDB contention and data file configuration
TempDB contention appears as PAGELATCH waits on allocation pages like PFS, GAM, and SGAM. Dozens of sessions hammer these pages simultaneously while creating and dropping temp tables or table variables.
The standard fix is multiple tempdb data files, with one per CPU core up to eight files, then add more if contention persists. Each file should be identically sized with identical autogrowth settings to ensure proportional fill. SQL Server’s proportional fill algorithm spreads writes across files, but only if they’re the same size.
MAXDOP and cost threshold for parallelism
MAXDOP controls how many CPU cores a single query can use. The default value of 0 means unlimited. A single report query can monopolize all 32 cores while dozens of OLTP queries wait. For many OLTP workloads, MAXDOP between 4 and 8 works well, preventing individual queries from dominating CPU while still allowing legitimate parallelism for larger operations.
Cost threshold for parallelism defaults to 5, an absurdly low value that causes trivial queries to spawn parallel plans. Every parallel query incurs coordination overhead when distributing work across threads, synchronizing results, and managing parallel zones. For queries that complete in milliseconds anyway, this overhead costs more than the parallelism saves. Raising this to 50 or higher prevents parallelism overhead for queries that won’t benefit from it.
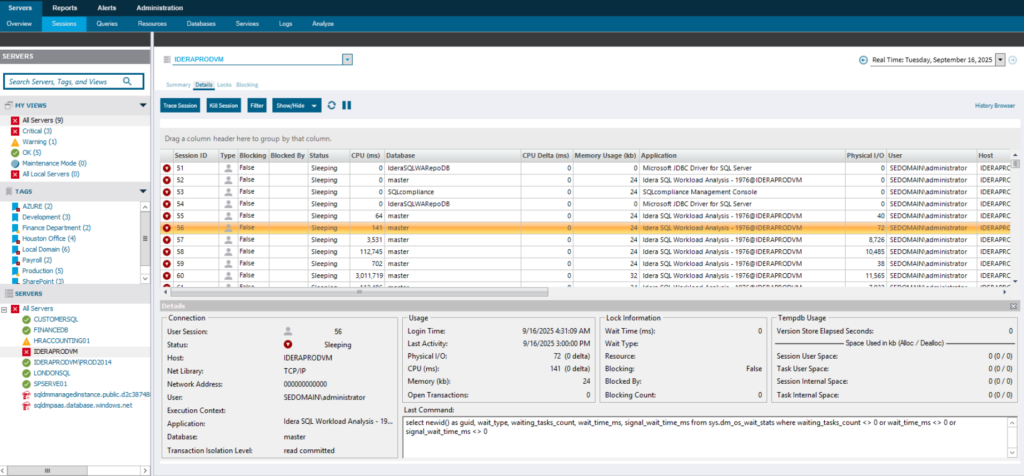
How SQL Diagnostic Manager Automates Performance Tuning
Knowing the tuning methodology is the easy part. Applying it across dozens of instances while keeping up with daily operational work is where most teams stall.
Doing this manually means writing queries against wait stats DMVs, running them across every instance, and building dashboards to interpret it all. That’s weeks of development time before you even start tuning.
SQL Diagnostic Manager handles the aggregation and interpretation, pulling wait stats, blocking chains, and query performance anomalies across your environment into a single view. You get context about whether a spike is unusual for your baseline or just normal operational variance.
When PAGEIOLATCH waits spike, you don’t just get an alert. You get diagnostic queries to identify which objects are causing I/O pressure and whether missing indexes or inefficient queries are the root cause. The recommendations include executable scripts, not just advice.
The SQL Query Tuner add-on adds visual query profiling. Analyze execution plans directly within the interface, see index usage statistics, and get specific recommendations for query rewrites or index additions. For teams just starting with structured performance monitoring, the SQL Check tool is free and runs health checks across your SQL Server instances.
Proactive SQL Server Monitoring vs. Reactive Troubleshooting
DBAs who rely on user complaints to surface performance issues are always behind, troubleshooting under pressure with incomplete information.
Proactive monitoring tracks wait statistics continuously and alerts on deviations from baseline before they become outages.
When a query that normally completes in 200 milliseconds suddenly takes 2 seconds, you investigate immediately rather than waiting for 50 users to call the help desk.
SQL Diagnostic Manager makes proactive monitoring practical at scale. Historical performance data lets you trend resource consumption over time, catching gradual degradation before it becomes an outage. Alert thresholds based on baseline behavior cut through alert fatigue by notifying you about meaningful changes, not just arbitrary threshold crossings.
Every minute you spend chasing symptoms is a minute your database keeps bleeding performance. The methodology is here. The bottlenecks are already telling you where they are.
Stop guessing. Start monitoring your SQL server performance with SQL Diagnostic Manager.
Brandon Adams
SQL Server Tools Product Marketing Manager
With over two decades of experience in SQL, SaaS, data center infrastructure, power quality, data storage, disaster recovery, and IT security, Brandon bridges technical expertise with business needs to help organizations get the most out of their data environments. He focuses on making complex database and infrastructure challenges easier to understand, enabling DBAs and IT leaders to improve performance, strengthen security, and simplify management.
Keep SQL Server Fast, Reliable and Secure - with SQL Diagnostic Manager