 |
Guyana, International Boundary Shapefile of the boundaries of Guyana as they appear in Open Street Map. Source: Open Street Map. |
(shp) |
 |
Outline Map of GuyanaMap of Guyana showing major towns and rivers.Source: Guyana Lands and Surveys Commission, 2006. |
(pdf) |
 |
Various Illustrative Maps of Guyana (jpgs)Useful maps of Guyana for your academic and other projects.Source: Maplandia.com |
|
 |
Guyana's Exclusive Economic Zone (200NM).Source: Flanders Marine Institute. |
|
 |
Guyana's Exclusive Economic Zone (200NM)Source: Digitized by GuyNode from shapefile available at Flanders Marine Institute. |
(shp) |
 |
Background to Guyana / Suriname Boundary DisputeShort, informative conference paper on the topic. Peggy Hoyle, 2001. |
|

|
Some Historic Boundary Maps of Guyana |
 |
Boundaries, Regional Democratic Councils (RDCs)) RDC web map and shapefile with population totals for each regions - 1980, 1991, 2002, 2012. Source: Base map obtained from Open Street Map. Demographic data obtained from the Bureau of Statistics, Guyana. |
(shp) |
 |
Illustrative Regional Map of Guyana Useful regional map of Guyana for your projects. Source: Guyana Land and Surveys Commission. |
(pdf) |
 |
Colorful Regional Map of Guyana A colorful map of Guyana's Regional Democratic Councils that can be included in your Guyana project. Saves the time of creating it yourself Source: Maplandia.com. |
(jpg) |
 |
Region 1, Barima-Waini (png) Map of Region One Source: Guyana Lands and Surveys Commission. |
(png) |
 |
Region 1, Barima-Waini, Guyana, Boundary Web Map and Shapefile Region One Source: Open Street Map. |
(shp) |  |
Region 2, Pomeroon-Supenaam Map of Region Two Source: Guyana Lands and Surveys Commission. |
(png) |
 |
Region 3, Essequibo Islands-West Demerara Map of Region Three Source: Guyana Lands and Surveys Commission. |
(png) |
 |
Region 4, Demerara-Mahaica Map of Region Four Source: Guyana Lands and Surveys Commission. |
(png) |
 |
Region 5, Mahaica-Berbice Map of Region Five Source: Guyana Lands and Surveys Commission. |
(png) |
 |
Region 6, East Berbice-Corentyne Map of Region Six Source: Guyana Lands and Surveys Commission. |
(png) |
 |
Region 7, Cuyuni-Mazaruni Map of Region Seven Source: Guyana Lands and Surveys Commission. |
(png) |
 |
Region 8, Potaro-Siparuni Map of Region Eight Source: Guyana Lands and Surveys Commission. |
(png) |
 |
Region 9, Upper Takutu-Upper Essequibo Map of Region Nine Source: Guyana Lands and Surveys Commission. |
(png) |
 |
Region 9, Upper Takutu-Upper Essequibo, Guyana, Boundary Web Map and Shapefile Region Nine Source: Open Street Map. |
(shp) |  |
Region 10, Upper Demerara-Berbice Map of Region Ten Source: Guyana Lands and Surveys Commission. |
(png) |
 |
City of Georgetown (Census Districts) This shapefile contains Georgetown census districts as well as the 2012 population of each census district.
|
(shp) |

|
Population of Census Districts in Georgetown, 2012 Source: Bureau of Statistics, Guyana. |
(xlsx) Download |
 |
Georgetown Constituencies and Local Govt Results, 2023
Digitized by GuyNode Data Source: GECOM |
(shp) |
 |
Town of Linden (Census Districts, 2012) Shapefile of the 20 census districts of the Town of Linden. Population data are also available for the districts. This layer was developed by GuyNode to support thematic mapping in Linden. Data Source Census district names are those used in the 2012 census for Linden. Census district boundaries were digitized from Open Street Map, Google Map, Bing Map, and other maps found on the Internet. Some district boundaries may still need editing. An official census district shapefile from the Statistical Bureau could not be located. |
(shp) |
 |
Linden Constituencies and Local Govt Election Results, 2023
Constituency boundaries digitized from GECOM's documentation.. Some constituency boundaries may need editing. An official constituency shapefile from GECOM could not be located..
| (shp) |
 |
Town of Linden, Administrative Boundaries and Main Roads This map outlines the official boundary of Linden. The boundary is different from what appears on Goole Map, Open Street Map, and Bing Map. Data Source: Guyana Lands and Surveys Commission. |
(pdf) |
 |
Town of New Amsterdam Administrative Map. This map contains streets and communties in New Amsterdam. Map Scale: 1: 10,000. Data Source: Guyana Lands and Surveys Commission. |
(pdf) |
 |
Town of New Amsterdam, Census Districts shapefile. An official census district shapefile of New Amterdam from the Bureau of Statistics is unavailable, so this layer was developed by GuyNode to fill the gap for researchers. Data Source: Names of Census districts obtained from national census. Census district boundaries digitized by GuyNode using the New Amsterdam administrative map above, Google Map, and Open Street Layer. Attribute data obtained from the national census. |
(shp) |
 |
Town of Rose Hall, Administrative Map
Map Scale: 1: 10,000 Data Source: Guyana Lands and Surveys Commission |
(pdf) |
 |
Town of Rose Hall, Constituencies
Shapefile of constituency boundaries. Digitized by GuyNode Data Source: GECOM. |
(shp) |
 |
Town of Corriverton, Constituencies
Shapefile of constituency boundaries. Digitized by GuyNode Digitized by GuyNode Data Source: GECOM. |
(shp) |
 |
Town of Anna Regina, Constituencies Shapefile of constituency boundaries. Digitized by GuyNode Data Source: GECOM. |
(shp) |
 |
Town of Bartica, Constituencies
Digitized by GuyNode |
(shp) |
 |
Township of Bartica
Ungeoreferenced map of Bartica.
Data Source: Guyana Lands and Surveys Commission |
(pdf) |
 |
Town of Lethem, Constituencies Shapefile digitized by GuyNode Data Source: GECOM |
(shp) |
 |
Administrative Boundary, Township of Lethem
Ungeoreferenced map of the Township of Lethem and surrounding areas.
Data Source: Guyana Lands and Surveys Commission |
(pdf) |
 |
Mahdia Settlement Web Map and Shapefile of the new Town of Mahdia | (shp) |
 |
Town of Mahdia
1: 90,000 Ungeoreferenced map of Mahdia
Data Source: Guyana Lands and Surveys Commission |
(pdf) |
 |
Administrative Boundaries, Mabaruma Township Map Scale: 1: 20,000 Data Source: Guyana Lands and Surveys Commission |
(pdf) |
 |
Town of Mabaruma Shapefile digitized by GuyNode Data Source: GECOM, 2016 |
(shp) |
 |
Silica City Digitized by GuyNode Data Source: Ministry of Housing and Water via Stabroek News |
(shp) |
 |
Admin Boundaries of Classified NDCs, Guyana Shapefile and story map of boundaries of classified Neighborhood Democratic Councils, 2018. NDCs are local government units located mostly in coastal areas. They typically consist of groups of villages. This dataset contains 2012 population data for the NDCs. Source: Bureau of Statistics, Guyana. |
(shp) |
 |
Classified and Unclassified NDC Boundaries, Guyana Shapefile of areas classified as NDCs and areas earmaked to be classified as NDCs. Census data are available for this NDC layer. Source: GADM maps and data |
(shp) |

|
List of NDCs in Guyana, 2018 Neighborhood Democratic Councils (NDCs) are basically rural local government units. Other local govt units are city, towns, and Amerindian Villages. In 2018, Guyana had 65 NDCs, most of which are located on the coast. Source: Bureau of Statistics, Guyana. |
(xlsx) Download |
|
Demographic Data, 2002 by NDCs Population and Household datasets for NDCs, 2002 Source: Bureau of Statistics, Guyana. |
(zip) Download |

|
NDC Boundaries - Region 1 Shapefile showing boundary of the single NDC in Region 1. Mabaruma is no longer a NDC. It is now a town. |
(shp) |

|
NDC Boundaries - Region 2 Shapefile showing boundaries of NDCs in Region 2. Contains population of NDCs. |
(shp) |

|
NDC Boundaries - Region 3 Shapefile showing boundaries of NDCs in Region 3. Contains population of NDCs. |
(shp) |

|
NDC Boundaries - Region 4 Shapefile showing boundaries of NDCs in Region 4. Contains population of NDCs. |
(shp) |

|
NDC Boundaries - Region 5 Shapefile showing boundaries of NDCs in Region 5. Contains population of NDCs. |
(shp) |

|
NDC Boundaries - Region 6 Shapefile showing boundaries of NDCs in Region 6. Contains population of NDCs. |
(shp) |

|
NDC Boundaries - Region 10 Shapefile showing boundaries of NDCs in Region 10. Contains population of NDCs. |
(shp) |
 |
Interactive Map, Farm Woodlands NDC Interactive web mapping application displaying basic map layers in Farm-Woodlands, NDC, Mahaicony. Source:Web map developed by GuyNode. |
|
 |
Combined local government areas, Guyana Combined local government areas - RDCs, NDCs, Municipalities, and Amerindian Villages. Source:Shapefile integrated by GuyNode. Web map developed by GuyNode. |
(shp) |
 |
Boundaries of Electoral Constituencies Electoral constituency boundaries within municipalities and NDCs as defined by Guyana Elections Commission (GECOM) for all NDCs in Guyana, 2015. |
|
 |
Local Government Constituencies Constituencies of NDCs and Municipalities. Partially completed layer. Source:GuyNode. |
(shp) |
 |
Search for your Electoral Constituency Enter your address into this app and find your local government area including RDC, Municipality, NDC and Amerindian Village. Electoral constituencies still being digitized. |
 |
Guyana's Coastal Villages (tif) Map drawn by the Directorate of Colonial Surveys, 1949. Villages on Essequibo coast not included. Source: Princeton University Library. |
|
 |
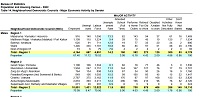
Coastal Villages Village polygons for most of Guyana's coast. Some additional editing of village boundaries may be necessary. Layers contains population totals from the 2012 census. Source: Village polygons obtained from Map drawn by the Directorate of Colonial Surveys, 1949 Digitized by GuyNode. |
(shp) |
 |
Village Level Population & Household Data, 2012 Population Household These are standalone pdf tables that can be converted to xls format and joined to the village level shapefile for GIS mapping and analysis. Source: Bureau of Statistics, Guyana. |
|
 |
Villages - Region 5, Mahaica-Berbice Village polygons for NDCs in Region 5. Contains Census 2012 population for each village. Source: Village boundaries obtained from Map drawn by the Directorate of Colonial Surveys, 1949. Digitized by GuyNode. |
(shp) |
 |
Amerindian Areas Interactive map and shapefile of Amerindian lands in Guyana. This map is an indicative geographic product and not a legal document. Data for the map are the output of the Amerindian Land Titling Project in Guyana. Source: Landmark, the Global Platform of Indigenous Lands and Community Lands. |
(shp) |
|
|
Amerindian Villages in Guyana List of Villages Source: Ministry of AmerIndian Affairs, Guyana |
(xlsx) |
 |
Amerindian's Peoples Spatial Database, Guyana This project assembles and updates spatial data pertaining to the lands and lives of indigenous people in Guyana. Source: Amerindian Peoples Association, Guyana |

 |
Gazetted Place Names in Guyana, 2012 (csv) Gazetted Place Names (1,400 entries). Names compiled into a single csv file for easy download. Source: Guyana Gazeteer (via slideshare.net). |
|
 |
Place Names in Guyana from GeoNames (csv) Comprehensive list of place names in Guyana. Source: GeoNames. Visit GeoNames for latest list. |
|
 |
Plantations and Negro Villages, British Guiana, 1860. | (pdf) |
 |
Historic Look at Mackenzie.
Be sure to click on the Watooka links to the right side of the page. |
 |
Historical Maps of Guyana Download various historical maps of Guyana from Old Maps Online |
|
 |
Historical Maps of Guyana Download various historical maps of Guyana from Dave Rumsey''s Map Collection) |
|
 |
Vintage Town Map, Georgetown, 1914 Source: Amazon.ca |
|
 |
Chart of Guyana's Coast, 1781 Chart of the coast of Guayana from Rio Orinoco to River Berbice, containing the Dutch colonies of Poumaron, Issequibo and Demerary, and Berbice |
Featured Datasets, Maps, News, etc
WikiProject Guyana
